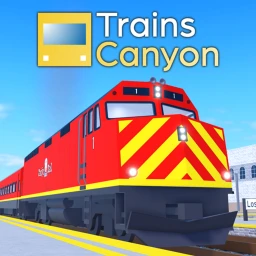
Trains: Canyon
#7,608Since Aug 19, 2026
Player count history
Performance analysis
Measured on average concurrent players rather than a single spike, Trains: Canyon is up 18.8% day over day, up 9.5% week over week, down 38.9% over 30 days.
Trains: Canyon set its observed peak 44 days ago; its 7-day average is 29% of that peak.
Over the last 14 days, Trains: Canyon was usually busiest in the hour from 16:00 UTC, averaging 2.4× its quietest hour. Across the last 14 whole UTC days it averaged 59% more players on Saturdays and Sundays than on weekdays.
Player counts by period
| Period | Average | Peak | Change |
|---|---|---|---|
| Last 24 hours | 19 | 36 | ▲ 18.8% |
| Last 7 days | 23 | 60 | ▲ 9.5% |
| Last 30 days | 22 | 60 | ▼ 38.9% |
| Since Aug 19, 2026 | — | 80 | 50 days tracked |
Growth
| Metric | 24h | 7d | 30d |
|---|---|---|---|
| Visits gained | +2.7K | +25.9K | +101.9K |
| Favorites gained | +7 | +65 | +219 |
| Likes gained | +0 | 78.6% positive overall | |
| Dislikes gained | +1 | 9,102 👍 · 2,482 👎 | |
| Totals | 23.4M visits · 28.3K favorites | ||
Rankings
| Live players | #7,608 · Top 50% |
| 24h peak | #8,523 · Top 50% |
| Observed peak | #9,717 · Top 50% |
| Total visits | #4,207 · Top 25% |
| Favorites | #9,077 · Top 50% |
| Rating | #8,937 |
| In Simulation | #2,886 of 7,324 |
Records
| Highest recorded CCU | 80 · Aug 23, 2026 |
| Best day for visits | +7.6K · Aug 23, 2026 |
| 24h low | 6 |
| Avg. session (est.) | 10 min |
| Tracked since | Aug 19, 2026 |
| Days with recorded data | 50 days of history |
Daily breakdown
| Day (UTC) | Avg players | Peak players | Visits gained |
|---|---|---|---|
| Oct 7, 2026 | 15 | 19 | +673 |
| Oct 6, 2026 | 17 | 36 | +2.7K |
| Oct 5, 2026 | 18 | 33 | +3.1K |
| Oct 4, 2026 | 33 | 60 | +5.3K |
| Oct 3, 2026 | 29 | 51 | +5.1K |
| Oct 2, 2026 | 22 | 46 | +3.8K |
| Oct 1, 2026 | 18 | 37 | +3K |
| Sep 30, 2026 | 20 | 35 | +3.3K |
| Sep 29, 2026 | 19 | 31 | +3K |
| Sep 28, 2026 | 18 | 33 | +2.7K |
| Sep 27, 2026 | 28 | 44 | +4.7K |
| Sep 26, 2026 | 28 | 43 | +4.5K |
| Sep 25, 2026 | 18 | 27 | +3.1K |
| Sep 24, 2026 | 18 | 36 | +2.9K |
Estimated developer earnings
Modeled from average concurrent players, assumed earned Robux per player-hour by genre, and a fixed $0.0038 per earned Robux. These are not reported game earnings. The range is the central model divided and multiplied by three, not a confidence interval; actual earnings may fall outside it. Special DevEx rates, purchases, revenue shares and expenses are not modeled. Not financial data. Model assumption for this game: 2 earned Robux per player-hour. Formula and limitations.
Visits history
Compare Trains: Canyon
Side-by-side player counts, peaks and growth against games of a similar size:
 vs Cut In Half
 vs Melt Lava for Brainrots
 vs Kingdom Grow Obby
 vs Craft, Dig & Mine
Frequently asked questions
How many people are playing Trains: Canyon right now?
Trains: Canyon's latest recorded count is 18 concurrent players on Roblox, sampled at 2026-10-07 07:20 UTC. That is 5% below its average over the last 24 hours.
What is Trains: Canyon's highest recorded player count?
RoVitals began tracking Trains: Canyon on August 19, 2026; the highest count sampled since then is 80 on August 23, 2026; earlier peaks and peaks between samples may be higher.
Is Trains: Canyon growing or dying?
Trains: Canyon has grown 9.5% over the past 7 days, averaging 23 concurrent players against 21 the week before.
How many visits does Trains: Canyon have?
Trains: Canyon has been played 23,391,129 times in total, 101,914 of them in the past 30 days.
How much money does Trains: Canyon make?
The RoVitals model puts Trains: Canyon's developer earnings at roughly $1–$10 a day, from its average concurrent players and a genre earnings assumption. Roblox does not publish per-game revenue, and actual earnings can differ several-fold.
Description from Roblox, by Kettle Works
Welcome to the city of Los Fernando, part of the Trains series! Master an assortment of huge and powerful trains on a large railroad network, based in the USA.
More by Kettle Works
| Game | Playing | 24h peak | Visits | Rating |
|---|---|---|---|---|
 Trains: Express Trains: Express | 68 | 24.7M | 79% | |
 Trains Trains | 48 | 66.4M | 76% | |
 Trains: InterCity Trains: InterCity | 26 | 239.3K | 87% |
Similar Simulation games
| Game | Playing | 24h | 24h peak | Visits |
|---|---|---|---|---|
 (UPD) Cars Physics Drive (UPD) Cars Physics Drive | ▲ 0.0% | 46 | 58.7M | |
 Generation Trains Generation Trains | ▲ 12.5% | 53 | 5.7M | |
![[UPDATE] Bikelife Miami 2 icon](https://tr.rbxcdn.com/180DAY-5fae2cc444c74b243c29ff61f3ac6083/75/75/Image/Webp/noFilter) [☀️🌴UPDATE] Bikelife Miami 2 [☀️🌴UPDATE] Bikelife Miami 2 | ▼ 11.5% | 45 | 59.1M | |
 Rails Unlimited Rails Unlimited | ▲ 0.0% | 55 | 42.9M | |
 قطار يصطدم بسيارة للعرب القطار مقابل السيارة للعرب قطار يصطدم بسيارة للعرب القطار مقابل السيارة للعرب | ▲ 6.7% | 37 | 4M | |
 🇧🇷 OFFROAD | Brazilian Mechanics 🇧🇷 OFFROAD | Brazilian Mechanics | ▼ 10.3% | 282 | 18.4M | |
 Uh Oh Stinky Uh Oh Stinky | ▲ 22.2% | 19 | 12.8M | |
![High Iron [Alpha] icon](https://tr.rbxcdn.com/180DAY-97a9c5f2363f5ff8c798c2a8322a7937/75/75/Image/Webp/noFilter) High Iron [Alpha] High Iron [Alpha] | ▼ 28.6% | 23 | 1.7M |
History since Aug 19, 2026. Data methodology.