Pinewood Research Center 2009
- Playing now
- 0
- — 24h average vs the day before
- 24h average
- 0
- 24h peak
- 0
- 7-day peak
- 0
Player count history
Concurrent playersPinewood Research Center 2009 has 0 players online in the latest RoVitals sample. The highest count RoVitals has recorded since tracking began on Sep 6, 2026 is 1, on Oct 4, 2026. Over the last 7 days it averaged 0 players. It has 7.9K lifetime visits and 132 likes.
Performance analysis
Pinewood Research Center 2009 set its observed peak 38 days ago; its 7-day average is under 1% of that peak.
Player counts by period
| Period | Average | Peak | Change |
|---|---|---|---|
| Last 24 hours | 0 | 0 | — |
| Last 7 days | 0 | 0 | — |
| Last 30 days | 0 | 0 | — |
| Since Sep 6, 2026 | — | 1 | 67 days tracked |
Growth
| Metric | 24h | 7d | 30d |
|---|---|---|---|
| Visits gained | +0 | +5 | +42 |
| Favorites gained | +0 | +2 | +6 |
| Likes gained | +0 | — | |
| Dislikes gained | +0 | — | |
Visits, likes & favorites
Cumulative Roblox counters. Visits count game entries, not unique players.
- Total visits
- 7,901
- Favorites
- 316
- Likes
- 13294.3% positive
- Dislikes
- 8
Rankings
| Live players | — |
|---|---|
| 24h peak | — |
| Observed peak | #24,374 |
| Total visits | #29,537 |
| Favorites | #26,254 |
Records
| Observed peak | 1Oct 4, 2026 |
|---|---|
| Best day for visits | +5Sep 30, 2026 |
| 24h low | 0 |
| Tracked since | Sep 6, 2026 |
| Days with recorded data | 67 days of history |
Daily breakdown
| Day (UTC) | Avg players | Peak players | Visits gained |
|---|---|---|---|
| Nov 10, 2026 | 0 | 0 | +2 |
| Nov 9, 2026 | 0 | 0 | +1 |
| Nov 8, 2026 | 0 | 0 | +0 |
| Nov 7, 2026 | 0 | 0 | +1 |
| Nov 6, 2026 | 0 | 0 | +0 |
| Nov 5, 2026 | 0 | 0 | +3 |
| Nov 4, 2026 | 0 | 0 | +3 |
| Nov 3, 2026 | 0 | 0 | +1 |
| Nov 2, 2026 | 0 | 0 | +0 |
| Nov 1, 2026 | 0 | 0 | +5 |
| Oct 31, 2026 | 0 | 0 | +1 |
| Oct 30, 2026 | 0 | 0 | +0 |
| Oct 29, 2026 | 0 | 0 | +0 |
| Oct 28, 2026 | 0 | 0 | +0 |
Earnings model & assumptions
No positive 24-hour average is available for this model.
Visits history
Compare Pinewood Research Center 2009
Side-by-side player counts, peaks and growth against games of a similar size.
 vs Scary Killers in AREA-51! [Kill the Killers]
 vs Lua Learning
 vs [JAPAN WALK] Serband Animations
 vs A Very Hungry CaseOhCompare any two games
Frequently asked questions
How many people are playing Pinewood Research Center 2009 right now?
Pinewood Research Center 2009's latest recorded count is 0 concurrent players on Roblox, sampled at 2026-11-11 05:53 UTC.
What is Pinewood Research Center 2009's highest recorded player count?
RoVitals began tracking Pinewood Research Center 2009 on September 6, 2026; its observed peak, the highest count sampled since then, is 1 on October 4, 2026; earlier peaks and peaks between samples may be higher.
How many visits does Pinewood Research Center 2009 have?
Pinewood Research Center 2009 has been played 7,901 times in total, 42 of them in the past 30 days.
How many likes does Pinewood Research Center 2009 have?
Pinewood Research Center 2009 has 132 likes and 8 dislikes on Roblox, 94.3% positive among recorded votes. It has 316 favorites. These are game totals, separate from its concurrent player count.
Description from Roblox, by Tokaisho
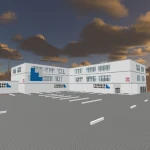
Welcome to Pinewood Research Center! Explore the original research facility from 2009 located in New Mexico, used by Pinewood Builders before the latest facility in the Sahara was built, Pinewood Research Facility, which is the place slot this map was once on originally. https://www.roblox.com/games/7692456/Pinewood-Research-Facility All restricted doors have been opened up and you may now have access, as this is a museum exploration place, see our past. Located belowground is the original computer core, built two years before the new dedicated Pinewood Computer Core game. Code door codes: "123"
More by Tokaisho
| Game | Players | 24h peak | Visits | Rating |
|---|---|---|---|---|
 ⛏️ Mega Minersby Tokaisho | 194 | 121.5M | 82% | |
 Pinewood Space Shuttle Advantageby Tokaisho | 20 | 56.6M | 75% | |
 Train Demolition by Tokaisho | 0 | 7.5M | 70% | |
 Pinewood Builders HQby Tokaisho | 0 | 1.3M | 87% | |
 Pinewood Research Facility by Tokaisho | 0 | 9.3M | 80% | |
 Underground 1 by Tokaisho | 0 | 59.7K | 97% |
Scroll the table to explore more metrics →
Games of a similar size
| Game | Players | 24h change | 24h peak | Visits |
|---|---|---|---|---|
 Eurovision Song Contest 2025by Nostalgia Productions Entertainment | ▲ 0.0% | 5 | 3.2M | |
 [RELEASE🎉] Badminton Allstarsby GaKay Studios | ▲ 200.0% | 5 | 179.6K | |
 Garden RNG 🎲by Twisted Mind Games | ▲ 0.0% | 5 | 27.5M | |
 [❄️] Steal a Alphabetby star games.. | ▲ 100.0% | 5 | 5.8M | |
 Digging Empireby Eternity Interactive | ▲ 0.0% | 5 | 10.6M | |
 Mutate or Lose Fishby OuiOuiOuiCroissant | — | 5 | 4.2M | |
 MR FUNNY'S PRISON RUN! (Obby)by Built to Ball | ▲ 100.0% | 5 | 654.2K | |
 My Japanese Food Standby Habit Games! | ▲ 100.0% | 5 | 2.8M |
Scroll the table to explore more metrics →
History since Sep 6, 2026. Data methodology.