- Playing now
- 0
- — 24h average vs the day before
- 24h average
- 1
- 24h peak
- 3
- 7-day peak
- 3
Player count history
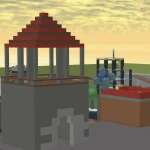
Concurrent playersCrossroads has 0 players online in the latest RoVitals sample. The highest count RoVitals has recorded since tracking began on Nov 5, 2026 is 3, on Nov 12, 2026. It has 8M lifetime visits and 7.9K likes.
Looking for Crossroads? This page tracks Crossroads by Temple of Brickbattle, a separate experience.
Player counts by period
| Period | Average | Peak | Change |
|---|---|---|---|
| Last 24 hours | 1 | 3 | — |
| Last 7 days | 1 | 3 | — |
| Last 30 days | 1 | 3 | — |
| Since Nov 5, 2026 | — | 3 | 6 days tracked |
Growth
| Metric | 24h | 7d | 30d |
|---|---|---|---|
| Visits gained | +19 | +443 | +443 |
| Favorites gained | +0 | +3 | +3 |
| Likes gained | +0 | — | |
| Dislikes gained | +0 | — | |
Visits, likes & favorites
Cumulative Roblox counters. Visits count game entries, not unique players.
- Total visits
- 8,000,610
- Favorites
- 26,303
- Likes
- 7,99781.7% positive
- Dislikes
- 1,791
Rankings
| Live players | — |
|---|---|
| 24h peak | #16,564 · Top 50% |
| Observed peak | #22,492 |
| Total visits | #8,404 · Top 25% |
| Favorites | #12,262 · Top 50% |
| Rating | #10,750 |
Records
| Observed peak | 3Nov 12, 2026 |
|---|---|
| Best day for visits | +99Nov 10, 2026 |
| 24h low | 0 |
| Avg. session (est.) | 76 min |
| Tracked since | Nov 5, 2026 |
| Days with recorded data | 6 days of history |
Daily breakdown
| Day (UTC) | Avg players | Peak players | Visits gained |
|---|---|---|---|
| Nov 10, 2026 | 0 | 0 | +99 |
| Nov 9, 2026 | 0 | 0 | +113 |
| Nov 7, 2026 | 0 | 0 | +91 |
| Nov 6, 2026 | 0 | 0 | +49 |
Earnings model & assumptions
Roblox does not publish this game's earnings. These scenarios use an assumed monetization rate.
- Illustrative daily range
- $0.03 – $0.27
- 30 days at unchanged activity and assumptions
- $0.91 – $8.2
Modeled from average concurrent players, assumed earned Robux per player-hour by genre, and a fixed $0.0038 per earned Robux. These are not reported game earnings. The range is the central model divided and multiplied by three, not a confidence interval; actual earnings may fall outside it. Special DevEx rates, purchases, revenue shares and expenses are not modeled. Not financial data. Model assumption for this game: 1 earned Robux per player-hour. Formula and limitations.
Visits history
Compare Crossroads
Side-by-side player counts, peaks and growth against games of a similar size.
 vs Black Hole Simulator
 vs Video Game Tycoon
 vs The Diving Experience
 vs +1 Speed Every ClickCompare any two games
Frequently asked questions
How many people are playing Crossroads right now?
Crossroads's latest recorded count is 0 concurrent players on Roblox, sampled at 2026-11-12 05:32 UTC. That is 100% below its average over the last 24 hours.
What is Crossroads's highest recorded player count?
RoVitals began tracking Crossroads on November 5, 2026; its observed peak, the highest count sampled since then, is 3 on November 12, 2026; earlier peaks and peaks between samples may be higher.
How many visits does Crossroads have?
Crossroads has been played 8,000,610 times in total, 443 of them since RoVitals began tracking it on November 5, 2026.
How many likes does Crossroads have?
Crossroads has 7,997 likes and 1,791 dislikes on Roblox, 81.7% positive among recorded votes. It has 26,303 favorites. These are game totals, separate from its concurrent player count.
How much money does Crossroads make?
Roblox does not publish Crossroads's earnings. The RoVitals illustrative model gives roughly $0.03–$0.27 per day using average concurrent players and an assumed genre earnings rate. This is a model scenario, not reported revenue or a confidence interval; actual earnings can fall outside the range.
Description from Roblox, by Temple of Brickbattle
The classic ROBLOX level is back!
More by Temple of Brickbattle
| Game | Players | 24h peak | Visits | Rating |
|---|---|---|---|---|
 Doomspire Brickbattleby Temple of Brickbattle | 179 | 927.5M | 83% | |
 Super Brick Plazaby Temple of Brickbattle | 0 | 189.1K | 87% | |
 The Bloxxing Deadby Temple of Brickbattle | 0 | 878 | 83% | |
 Outpost Brickbattleby Temple of Brickbattle | 0 | 35.4K | 90% | |
 Doomspire Minigames [ WELCOME ]by Temple of Brickbattle | 0 | 44.1K | 82% | |
 BRICKBATTLE PWNAGE: RESURGENCEby Temple of Brickbattle | 0 | 102.2K | 71% |
Scroll the table to explore more metrics →
Similar Action games
| Game | Players | 24h change | 24h peak | Visits |
|---|---|---|---|---|
 ⭐ Pillow Fight Simulator ⭐by Pillow Fighters | — | 0 | 34.9M | |
 💥 Heroes of Robloxia 💥by Team Super | ▲ 50.0% | 8 | 166.4M | |
 [UPDATE] Knife Simulatorby Zombie Attack Official | ▼ 100.0% | 0 | 158.7M | |
 Base Raiders 🧱by Base Productions | ▼ 100.0% | 1 | 92.5M | |
 ❄️Wizard Warsby Royal Studios® | ▲ 66.7% | 11 | 8.8M | |
 Marvel: Enhanced v.2by Witch's Group for Gifted Youngsters | — | 1 | 7.7M | |
 [Read desc] Neo Warfare Xby Military Flight Simulator Community | ▲ 12.5% | 27 | 32.4M | |
 ⚔️Meleeniacs⚔️ [WEAPONS RANDOMIZER]by The Axolotl Sun | ▲ 8.7% | 40 | 4.6M |
Scroll the table to explore more metrics →
History since Nov 5, 2026. Data methodology.