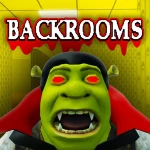
[🎃] Shrek in The Backrooms
- Playing now
- 639
- ▼ 4.5% 24h average vs the day before
- 24h average
- 947
- 24h peak
- 1,301
- 7-day peak
- 3,127
Player count history
Concurrent playersShrek in The Backrooms has 639 players online in the latest RoVitals sample. The highest count RoVitals has recorded since tracking began on Aug 12, 2026 is 3,289, on Aug 16, 2026. Over the last 30 days it averaged 1,149 players, up 24.5% on the 30 days before. It has 643.6M lifetime visits and 551.8K likes.
Performance analysis
Measured on average concurrent players rather than a single spike, Shrek in The Backrooms is down 4.5% day over day, down 5.0% week over week, up 24.5% over 30 days. Its last-24h average (947) is 33.4% below its 7-day average (1,422).
Shrek in The Backrooms set its observed peak 86 days ago; its 7-day average is 43% of that peak.
Over the last 14 days, Shrek in The Backrooms was usually busiest in the hour from 19:00 UTC, averaging 3.0× its quietest hour. Across the last 14 whole UTC days it averaged 50% more players on Saturdays and Sundays than on weekdays.
Player counts by period
| Period | Average | Peak | Change |
|---|---|---|---|
| Last 24 hours | 947 | 1,301 | ▼ 4.5% |
| Last 7 days | 1,422 | 3,127 | ▼ 5.0% |
| Last 30 days | 1,149 | 3,127 | ▲ 24.5% |
| Since Aug 12, 2026 | — | 3,289 | 92 days tracked |
Growth
| Metric | 24h | 7d | 30d |
|---|---|---|---|
| Visits gained | +98.6K | +1.1M | +3.9M |
| Favorites gained | +190 | +1,905 | +6,880 |
| Likes gained | +92 | — | |
| Dislikes gained | +14 | — | |
Visits, likes & favorites
Cumulative Roblox counters. Visits count game entries, not unique players.
- Total visits
- 643,675,923
- Favorites
- 1,342,880
- Likes
- 551,88888.8% positive
- Dislikes
- 69,298
Rankings
| Live players | #2,148 · Top 5% |
|---|---|
| 24h peak | #1,626 · Top 5% |
| Observed peak | #3,002 · Top 10% |
| Total visits | #298 · Top 1% |
| Favorites | #1,365 · Top 5% |
| Rating | #6,799 · Top 50% |
| In Survival | #236 of 2,931 |
Records
| Observed peak | 3,289Aug 16, 2026 |
|---|---|
| Best day for visits | +228.9KAug 16, 2026 |
| 24h low | 380 |
| Avg. session (est.) | 13 min |
| Tracked since | Aug 12, 2026 |
| Days with recorded data | 92 days of history |
Daily breakdown
| Day (UTC) | Avg players | Peak players | Visits gained |
|---|---|---|---|
| Nov 10, 2026 | 829 | 1,399 | +102.8K |
| Nov 9, 2026 | 963 | 1,782 | +115.2K |
| Nov 8, 2026 | 1,746 | 2,680 | +196.9K |
| Nov 7, 2026 | 2,012 | 3,127 | +225.6K |
| Nov 6, 2026 | 1,310 | 2,457 | +160.3K |
| Nov 5, 2026 | 1,095 | 1,794 | +140.2K |
| Nov 4, 2026 | 1,178 | 1,844 | +136.4K |
| Nov 3, 2026 | 1,330 | 1,976 | +158.7K |
| Nov 2, 2026 | 1,404 | 2,412 | +164.6K |
| Nov 1, 2026 | 1,754 | 2,988 | +207.2K |
| Oct 31, 2026 | 1,477 | 2,357 | +176.2K |
| Oct 30, 2026 | 1,330 | 2,070 | +156K |
| Oct 29, 2026 | 1,238 | 1,810 | +150.5K |
| Oct 28, 2026 | 965 | 1,998 | +123.2K |
Earnings model & assumptions
Roblox does not publish this game's earnings. These scenarios use an assumed monetization rate.
- Illustrative daily range
- $29 – $260
- 30 days at unchanged activity and assumptions
- $860 – $7,800
Modeled from average concurrent players, assumed earned Robux per player-hour by genre, and a fixed $0.0038 per earned Robux. These are not reported game earnings. The range is the central model divided and multiplied by three, not a confidence interval; actual earnings may fall outside it. Special DevEx rates, purchases, revenue shares and expenses are not modeled. Not financial data. Model assumption for this game: 1 earned Robux per player-hour. Formula and limitations.
Visits history
Compare Shrek in The Backrooms
Side-by-side player counts, peaks and growth against games of a similar size.
 vs Baseplate Drifting
 vs (2 WEEKS) Apocalyptic Titans Roleplay
 vs Lethal Ape: Rewired!
 vs Build a Ring Farm 2Compare any two games
Frequently asked questions
How many people are playing Shrek in The Backrooms right now?
Shrek in The Backrooms's latest recorded count is 639 concurrent players on Roblox, sampled at 2026-11-11 12:17 UTC. That is 33% below its average over the last 24 hours.
What is Shrek in The Backrooms's highest recorded player count?
RoVitals began tracking Shrek in The Backrooms on August 12, 2026; its observed peak, the highest count sampled since then, is 3,289 on August 16, 2026; earlier peaks and peaks between samples may be higher.
Is Shrek in The Backrooms growing or dying?
Over the past 7 days Shrek in The Backrooms averaged 1,422 concurrent players, down 5.0% on the 1,497 of the week before. Over the past 30 days it averaged 1,149, up 24.5% on the 923 of the 30 days before. The weekly and monthly changes point in opposite directions.
How many visits does Shrek in The Backrooms have?
Shrek in The Backrooms has been played 643,675,923 times in total, 3,904,376 of them in the past 30 days.
How many likes does Shrek in The Backrooms have?
Shrek in The Backrooms has 551,888 likes and 69,298 dislikes on Roblox, 88.8% positive among recorded votes. It has 1,342,880 favorites. These are game totals, separate from its concurrent player count.
How much money does Shrek in The Backrooms make?
Roblox does not publish Shrek in The Backrooms's earnings. The RoVitals illustrative model gives roughly $29–$260 per day using average concurrent players and an assumed genre earnings rate. This is a model scenario, not reported revenue or a confidence interval; actual earnings can fall outside the range.
Description from Roblox, by The MonkeyMan Fan Club
Watch your back going into the Halloween event... 🧛 Teleport to 30+ levels, discover new entities, and hidden items! Find your way through the never ending maze of wallpaper and buzzing lights to find the exit to discover new levels! Hopefully Shrek doesn't find you first! 🧱 Collect Materials! 🛠️ Craft Weapons! 🔫 Kill Entities! 🚪 Discover New Levels! 💰 Earn Coins! ❓ Find The Secrets! Tip: Search for items in hidden places. Thanks for checking out my game, be sure to like and tell a friend. Also make sure to join my group for a free banana gun and join my server for tips and early content. Also shout out to PLTW for making this game possible!
Similar Survival games
| Game | Players | 24h change | 24h peak | Visits |
|---|---|---|---|---|
 NPC or DIE! 💢by arashiyama | ▲ 8.7% | 1,203 | 391.8M | |
 [SOON] Scary Gorilla Tagby TheAnkleLocks | ▼ 5.8% | 885 | 16.1M | |
 STEAL COOKIES🍪by SilIy Creations | ▼ 4.8% | 762 | 281.7M | |
 [CHAPTER 2] FATHOMby 「The Crimson Crusaders」 | ▲ 7.6% | 2,686 | 7.8M | |
 Grannyby Promidius Games | ▲ 1.5% | 652 | 681.5M | |
 WARDEN 🐲 Sonaria Horror Escapeby Sonar Studios | ▲ 1.7% | 916 | 17.7M | |
 [JERRY DOG] Enter the Verity Mazeby MemeForge Studio | ▲ 2.5% | 227 | 1.3M | |
 3008 - 700 Playersby uglyburger0 | ▼ 7.0% | 214 | 52.9M |
Scroll the table to explore more metrics →
History since Aug 12, 2026. Data methodology.