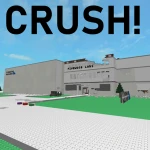
Crush a Building! (Pinewood Labs 2008)
- Playing now
- 0
- — 24h average vs the day before
- 24h average
- 0
- 24h peak
- 0
- 7-day peak
- 0
Player count history
Concurrent playersCrush a Building! (Pinewood Labs 2008) has 0 players online in the latest RoVitals sample. The highest count RoVitals has recorded since tracking began on Sep 6, 2026 is 1, on Sep 23, 2026. Over the last 7 days it averaged 0 players. It has 654.8K lifetime visits and 2K likes.
Performance analysis
Crush a Building! (Pinewood Labs 2008) set its observed peak 35 days ago; its 7-day average is under 1% of that peak.
Player counts by period
| Period | Average | Peak | Change |
|---|---|---|---|
| Last 24 hours | 0 | 0 | — |
| Last 7 days | 0 | 0 | — |
| Last 30 days | 0 | 0 | — |
| Since Sep 6, 2026 | — | 1 | 53 days tracked |
Growth
| Metric | 24h | 7d | 30d |
|---|---|---|---|
| Visits gained | +2 | +29 | +127 |
| Favorites gained | +0 | +2 | +5 |
| Likes gained | +0 | — | |
| Dislikes gained | +0 | — | |
Visits, likes & favorites
Cumulative Roblox counters. Visits count game entries, not unique players.
- Total visits
- 654,872
- Favorites
- 9,698
- Likes
- 2,00277.7% positive
- Dislikes
- 574
Rankings
| Live players | — |
|---|---|
| 24h peak | — |
| Observed peak | #21,031 |
| Total visits | #16,561 · Top 50% |
| Favorites | #14,728 · Top 50% |
| Rating | #11,305 |
Records
| Observed peak | 1Sep 23, 2026 |
|---|---|
| Best day for visits | +12Oct 11, 2026 |
| 24h low | 0 |
| Tracked since | Sep 6, 2026 |
| Days with recorded data | 53 days of history |
Daily breakdown
| Day (UTC) | Avg players | Peak players | Visits gained |
|---|---|---|---|
| Oct 27, 2026 | 0 | 0 | +10 |
| Oct 26, 2026 | 0 | 0 | +3 |
| Oct 25, 2026 | 0 | 0 | +6 |
| Oct 24, 2026 | 0 | 0 | +2 |
| Oct 23, 2026 | 0 | 0 | +2 |
| Oct 22, 2026 | 0 | 0 | +7 |
| Oct 21, 2026 | 0 | 0 | +5 |
| Oct 20, 2026 | 0 | 0 | +2 |
| Oct 19, 2026 | 0 | 0 | +3 |
| Oct 18, 2026 | 0 | 0 | +4 |
| Oct 17, 2026 | 0 | 0 | +5 |
| Oct 16, 2026 | 0 | 0 | +6 |
| Oct 15, 2026 | 0 | 0 | +4 |
| Oct 14, 2026 | 0 | 0 | +3 |
Earnings model & assumptions
No positive 24-hour average is available for this model.
Visits history
Compare Crush a Building! (Pinewood Labs 2008)
Side-by-side player counts, peaks and growth against games of a similar size.
 vs Tower Tycoon
 vs [legacy] untitled tag game
 vs [FIXED] Rooftop 2 (Basketball)
 vs Car Wash TycoonCompare any two games
Frequently asked questions
How many people are playing Crush a Building! (Pinewood Labs 2008) right now?
Crush a Building! (Pinewood Labs 2008)'s latest recorded count is 0 concurrent players on Roblox, sampled at 2026-10-28 21:37 UTC.
What is Crush a Building! (Pinewood Labs 2008)'s highest recorded player count?
RoVitals began tracking Crush a Building! (Pinewood Labs 2008) on September 6, 2026; its observed peak, the highest count sampled since then, is 1 on September 23, 2026; earlier peaks and peaks between samples may be higher.
How many visits does Crush a Building! (Pinewood Labs 2008) have?
Crush a Building! (Pinewood Labs 2008) has been played 654,872 times in total, 127 of them in the past 30 days.
How many likes does Crush a Building! (Pinewood Labs 2008) have?
Crush a Building! (Pinewood Labs 2008) has 2,002 likes and 574 dislikes on Roblox, 77.7% positive among recorded votes. It has 9,698 favorites. These are game totals, separate from its concurrent player count.
Description from Roblox, by Tokaisho
Back in the good old days, 2008 when I was a bit of a noob, I built this. It was the dawn of our company, Pinewood Builders Inc. But we called it Pinewood Labs back then. Well as you can see, it isn't in top condition, since it got abandoned, and nature took its course. But this is just a memory now, of what Pinewood used to be like. Now it's time to CRUSH IT!
More by Tokaisho
| Game | Players | 24h peak | Visits | Rating |
|---|---|---|---|---|
 ⛏️ Mega Minersby Tokaisho | 549 | 121M | 82% | |
 Pinewood Space Shuttle Advantageby Tokaisho | 21 | 56.5M | 75% | |
 Train Demolition by Tokaisho | 0 | 7.5M | 70% | |
 Pinewood Builders HQby Tokaisho | 0 | 1.3M | 87% | |
 Pinewood Research Facility by Tokaisho | 1 | 9.3M | 80% | |
 Underground 1 by Tokaisho | 0 | 59.6K | 97% |
Scroll the table to explore more metrics →
Games of a similar size
| Game | Players | 24h change | 24h peak | Visits |
|---|---|---|---|---|
 Bring a Drawing to Life!by SneezyBadger Games | — | 5 | 22M | |
 🐷 PEPPA PIG'S PRISON RUN! (Obby)by Cactus Games Studios | ▲ 0.0% | 5 | 3M | |
 99 Nights in the Forest Glass Bridgeby Apex Tech. | — | 5 | 10.1M | |
 Battle for Brainrots!by [Unknown] Games | — | 5 | 36M | |
 Sell Stranger Things and Prove Mom Wrongby Mega Tycoons Studios | ▲ 0.0% | 5 | 1.5M | |
 +1 Muscle Every Second 💪by TPC Games | ▲ 100.0% | 5 | 14.4M | |
 [EVENT X30] Mount Matahariby Lava Project | — | 5 | 975.7K | |
 +1 Speed Devil Fruit Escapeby The Sleeping Studio | ▼ 33.3% | 5 | 2.8M |
Scroll the table to explore more metrics →
History since Sep 6, 2026. Data methodology.