Sssqd
- Players now
- 416
- across all their games
- Sum of 24h peaks
- 497
- per-game peaks, at different times
- Total visits
- 672.7M
- 672,664,465
- Total favorites
- 1.8M
- Creator rank
- #2,533
- of 15,340 tracked creators
- Best observed peak
- 1,401
- Cook Burgers
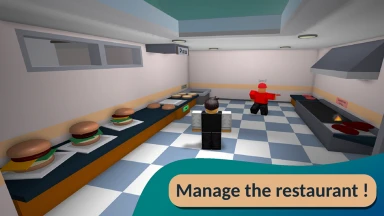
Sssqd has 27 games tracked by RoVitals, together holding 416 concurrent players right now and 672.7M lifetime visits. Their biggest title by observed peak is Cook Burgers at 1,401 concurrent players. That places Sssqd #2,533 of 15,340 creators RoVitals tracks, holding under 0.01% of all players currently in a tracked Roblox game across Simulation.
All games by Sssqd
| # | Game | Players | 24h change | 24h peak | 7d peak | Observed peak | Visits | Favorites | Rating | Last 7 days |
|---|---|---|---|---|---|---|---|---|---|---|
| 1 |  Cook Burgersby Sssqd | ▼ 18.1% | 497 | 901 | 1,401since Aug 12, 2026 | 664.9M | 1.7M | 82% | ||
| 2 |  Cook Burgers, but with 100 playersby Sssqd | — | 0 | 0 | 9since Aug 28, 2026 | 6.1M | 20.8K | 62% | ||
| 3 |  Cook Sandwiches (Classic)by Sssqd | — | 0 | 0 | 1since Aug 28, 2026 | 1.6M | 13.9K | 67% | ||
| 4 | — | 0 | 0 | 0since Aug 28, 2026 | 541 | 48 | 88% | |||
| 5 | — | 0 | 0 | 0since Aug 28, 2026 | 14 | 2 | — | |||
| 6 |  Get lost in the desert simulator!by Sssqd | — | 0 | 0 | 0since Aug 28, 2026 | 544 | 8 | 75% | ||
| 7 |  The Portalby Sssqd | — | 0 | 0 | 0since Aug 28, 2026 | 27.9K | 801 | 89% | ||
| 8 | — | 0 | 0 | 0since Aug 28, 2026 | 206 | 13 | 90% | |||
| 9 | — | 0 | 0 | 0since Aug 28, 2026 | 431 | 25 | 93% | |||
| 10 | — | 0 | 0 | 0since Aug 28, 2026 | 432 | 11 | 92% | |||
| 11 | — | 0 | 0 | 0since Aug 28, 2026 | 725 | 18 | 95% | |||
| 12 | — | 0 | 0 | 0since Aug 28, 2026 | 114 | 3 | 83% | |||
| 13 | — | 0 | 0 | 0since Aug 28, 2026 | 30 | 0 | 100% | |||
| 14 | — | 0 | 0 | 0since Aug 28, 2026 | 586 | 21 | 76% | |||
| 15 |  RAT TEMPLEby Sssqd | — | 0 | 0 | 0since Aug 28, 2026 | 12.5K | 254 | 84% | ||
| 16 |  Reflectariumby Sssqd | — | 0 | 0 | 0since Aug 28, 2026 | 11K | 667 | 89% | ||
| 17 | — | 0 | 0 | 0since Aug 28, 2026 | 311 | 3 | 71% | |||
| 18 | — | 0 | 0 | 0since Aug 28, 2026 | 131 | 8 | 86% | |||
| 19 |  Freebuild testby Sssqd | — | 0 | 0 | 0since Aug 28, 2026 | 150 | 8 | 70% | ||
| 20 | — | 0 | 0 | 0since Aug 28, 2026 | 722 | 31 | 86% | |||
| 21 | — | 0 | 0 | 0since Aug 28, 2026 | 610 | 20 | 82% | |||
| 22 | — | 0 | 0 | 0since Aug 28, 2026 | 97 | 2 | 100% | |||
| 23 |  The Forgeby Sssqd | — | 0 | 0 | 0since Aug 28, 2026 | 4.3K | 433 | 76% | ||
| 24 | — | 0 | 0 | 0since Aug 28, 2026 | 477 | 15 | 86% | |||
| 25 |  Mini Minersby Sssqd | — | 0 | 0 | 0since Aug 28, 2026 | 20 | 15 | 100% | ||
| 26 | — | 0 | 0 | 0since Aug 28, 2026 | 941 | 10 | 92% | |||
| 27 | — | 0 | 0 | 0since Aug 28, 2026 | 2.6K | 17 | 90% |
Scroll the table to explore more metrics →
Newest row observation:
About these metrics
Changes compare average concurrent players in the selected period with the previous equal period. Δ is the change in players; % is the relative change. A dash means no usable baseline or insufficient history.
Rolling peaks cover the named window. Observed peak is the highest sample since tracking began, rather than a verified lifetime record.
Collection methods and coverage ↗